
In an era where data drives decisions across industries, the complexity of creating visualizations often poses a significant barrier for many analysts and researchers, slowing down critical processes. Consider the challenge faced by a business analyst needing to quickly generate a detailed plot during a high-stakes meeting, only to be hindered by intricate coding syntax. This is where voice-activated R visualization tools step in, offering a revolutionary approach to data interaction. By allowing users to create complex plots through simple spoken commands, these tools promise to streamline workflows and democratize data science. This review delves into the innovative landscape of voice-activated technology within the R programming environment, spotlighting Posit’s groundbreaking contributions and their potential to reshape how data is visualized and understood.
The Rise of Voice-Driven Data Tools
The advent of voice-activated tools for data visualization in R marks a pivotal shift in how analysts interact with data. Leveraging advancements in generative AI and natural language processing, these tools enable users to bypass traditional coding by issuing spoken instructions to generate plots and scripts. This technology emerges at a time when the demand for intuitive, accessible data analysis solutions is at an all-time high, catering to both seasoned data scientists and novices who may lack deep programming expertise.
Such innovations align with broader trends in data science toward more natural user interfaces. The ability to converse with software as one would with a colleague reduces the cognitive load associated with remembering specific code syntax. As a result, the focus shifts from technical barriers to creative exploration of data insights, setting the stage for a more inclusive analytics environment.
Breaking Down Posit’s Innovative Tools
ggbot2: Simplifying ggplot2 with Voice Commands
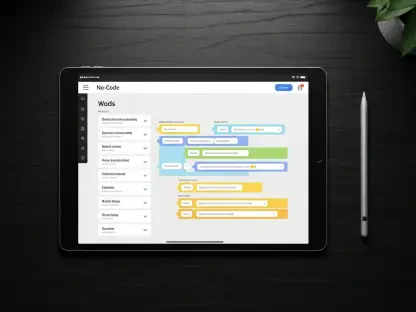
Among the standout tools in this space is ggbot2, a voice assistant for the popular ggplot2 package, unveiled at the recent posit::conf. This tool empowers users to craft data visualizations by simply describing the desired output in spoken words, transforming complex tasks into intuitive interactions. Whether it’s generating a bar chart or a scatter plot, ggbot2 interprets user intent and produces both the visual output and the underlying R code, seamlessly integrating with user-provided data frames.
The significance of ggbot2 lies in its capacity to democratize visualization tasks that often require extensive knowledge of ggplot2’s intricacies. During testing, it demonstrated impressive accuracy in rendering plots based on straightforward requests, such as visualizing population changes across regions. However, its performance can falter with more nuanced instructions, occasionally necessitating manual intervention to refine the output, highlighting areas for further improvement.
shinyrealtime: Expanding Voice Interaction Across Languages
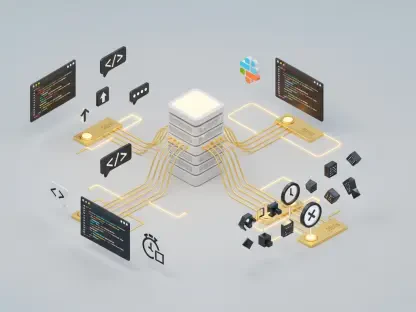
Complementing ggbot2 is shinyrealtime, a package that integrates OpenAI’s Realtime API with Shiny apps to facilitate conversational voice interactions. This tool extends beyond R, enabling the generation of visualization code in Python as well, thus catering to a broader audience of data professionals. Its low-latency design ensures fluid exchanges, making it feel like a genuine dialogue with the software.
A key strength of shinyrealtime is its versatility in handling multi-language environments, allowing users to switch between R and Python outputs based on their project needs. This adaptability positions it as a bridge for cross-platform data work, though it requires a stable internet connection and an API key, which may introduce additional costs. Its early-stage development suggests that more robust features and optimizations are on the horizon.
Cutting-Edge Trends in Conversational Data Science
The debut of tools like ggbot2 and shinyrealtime at posit::conf signals a rapid evolution in voice-activated R technologies. Within weeks of their introduction, Posit released these packages for public testing, reflecting an agile response to community interest. This swift rollout underscores a growing momentum in the data science field toward conversational AI interfaces that prioritize natural interaction over conventional coding practices.
Emerging trends also point to an increased focus on user experience, with developers aiming to minimize the learning curve associated with data tools. The shift toward voice as a primary input method mirrors advancements in other tech sectors, where hands-free operation enhances efficiency. As these tools gain traction, they are likely to inspire similar innovations across other programming ecosystems, potentially standardizing voice interaction as a norm in analytics.
Practical Impact Across Diverse Sectors
Voice-activated R visualization tools are already proving their worth in real-world applications, from academic research to business analytics. In testing scenarios, users have successfully created bar plots for population data and maps for state-level statistics by voicing simple commands. These tools shine in iterative processes, where analysts can refine visualizations through ongoing spoken feedback, such as adjusting axis labels or sorting data displays.
The implications for various sectors are profound, particularly in environments where speed and clarity are paramount. For instance, educators can use these tools to demonstrate data concepts in classrooms without delving into code, while corporate teams can generate on-the-fly reports during strategy sessions. Such versatility highlights the potential of voice-driven solutions to enhance productivity and communication of data-driven insights.
Beyond immediate applications, these technologies open doors for collaborative workflows, especially in remote settings where screen-sharing and verbal explanations often dominate. By reducing the dependency on written code, they foster a more dynamic exchange of ideas among team members with varying technical backgrounds. This inclusivity could redefine how data projects are approached in multidisciplinary teams.
Navigating Technical and Practical Hurdles
Despite their promise, voice-activated R visualization tools face several challenges that temper their current utility. Technical issues, such as dependency errors from missing packages, can disrupt workflows, often requiring users to possess some coding knowledge to resolve issues like unloaded libraries. This limitation underscores that these tools are not yet fully accessible to complete beginners.
Practical barriers also exist, including the cost of API usage for real-time voice processing and the necessity for compatible browsers like Chrome or Firefox to access microphone inputs. Handling highly complex visualizations remains a weak point, as the AI may misinterpret intricate requests or produce suboptimal code. These hurdles suggest that while innovative, the technology is still in a nascent stage.
Posit is actively addressing these obstacles, with ongoing efforts to enhance tool stability and broaden accessibility. Future updates may focus on reducing dependency on external APIs and improving error handling to minimize user intervention. Until then, users must weigh the convenience of voice interaction against the occasional need for manual troubleshooting.
Charting the Path Ahead for Voice in R
Looking forward, the trajectory of voice-activated R visualization technologies appears promising, with potential advancements poised to address current shortcomings. Improved AI models could enhance the accuracy of code generation, particularly for complex visualizations, while deeper integration with other data science workflows might streamline end-to-end analysis processes. Such developments would solidify voice tools as indispensable assets in the R ecosystem.
Another area of growth lies in making these tools more inclusive, catering to non-coders and experts alike. Features like customizable voice prompts or multilingual support could expand their reach globally, breaking down language and skill barriers. Over the next few years, from 2025 to 2027, expect to see iterative improvements that refine user experience and reduce operational costs.
The long-term impact could transform data visualization into a more intuitive craft, where the focus shifts entirely to interpreting results rather than crafting code. As these technologies mature, they may inspire a new generation of data tools that prioritize human-centric design, fundamentally altering how insights are derived and shared across industries.
Reflecting on a Transformative Leap
Looking back, the exploration of voice-activated R visualization tools like ggbot2 and shinyrealtime revealed a landscape brimming with potential yet tempered by early-stage limitations. Their ability to simplify complex plotting tasks through spoken commands stood out as a significant advancement, though technical hiccups and dependency on user expertise occasionally hindered seamless operation. The journey through their real-world applications underscored a clear value in enhancing accessibility and speed in data analysis.
Moving forward, the next steps for stakeholders involve active engagement with Posit’s ongoing development efforts, providing feedback to shape future iterations of these tools. For users, experimenting with these packages in controlled settings can uncover niche use cases, while developers might consider integrating complementary features like offline functionality. As the technology evolves, staying attuned to updates and community insights will be crucial in harnessing its full potential for transforming data interaction.