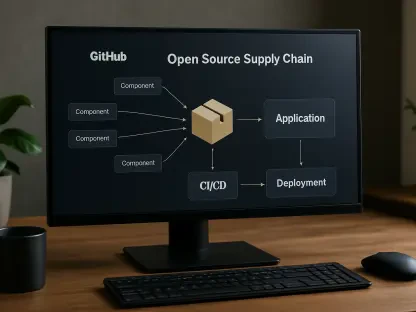

The intricate web of microservices that underpins contemporary applications often creates a significant bottleneck for development teams waiting on unfinished or costly third-party APIs to test their code properly. In the past, massive monolithic applications were the norm, but the shift to cloud-native development has fragmented these into collections of specialized services linked by APIs. This distributed architecture brings immense benefits in scalability and reliability, allowing applications to grow with user demand and gracefully handle infrastructure failures. However, it introduces complexity for developers. Agile methodologies further break down services across different teams, all while demanding rigorous, test-driven approaches. This creates a common dilemma front-end component might be ready for testing, but the back-end services it depends on are still under construction. Furthermore, relying on third-party APIs during the development phase can introduce unacceptable costs or rate limits, hindering progress and inflating budgets before a product even launches.
1. The Critical Role of API Simulation
To navigate these challenges, development teams increasingly turn to API simulation, a practice that decouples front-end and back-end workflows by creating stand-ins for live services. An API simulator acts as a generic, configurable tool within the development environment, intercepting network calls from an application and delivering predefined, expected responses. This allows developers to proceed with their work productively, even when the actual APIs are unavailable. Beyond simply providing dummy data, a sophisticated simulator can test an application’s resilience by injecting various classes of errors, such as server timeouts, authentication failures, or malformed responses. It can also mimic the behavior of API management layers by simulating throttling and rate limiting, providing a controlled environment to introduce a degree of chaos into otherwise predictable operations. By leveraging an API specification, a simulator can automatically implement the required endpoints, eliminating the need for teams to spend valuable time and resources writing custom mock servers or incurring expenses on third-party API subscriptions during early development and testing phases. This approach ensures that parallel development streams can continue unimpeded, keeping projects on schedule and on budget.
In response to this growing need, Microsoft recently released a significant update to its specialized tool, Dev Proxy v2.0, which introduces major new features and breaking changes that refine the API testing process. This version is designed to be a powerful intermediary, capable of sitting between a live API and a development environment to monitor, modify, and mock traffic. A key improvement addresses previous inconsistencies that affected developers testing services like the Microsoft Graph APIs. In earlier releases, the proxy application did not always deliver results consistent with the live service; for instance, it used the local machine’s date formats, leading to discrepancies where developers in different regions would see different results, neither of which aligned with the RFC 1123 and ISO 8601 formats used by the actual service. The v2.0 release rectifies these issues, ensuring a more faithful simulation. Furthermore, the update brings support for the latest .NET release, future-proofing the tool and allowing it to integrate seamlessly into modern development stacks. This major release signals a commitment to providing developers with a robust, reliable, and highly configurable tool for testing the complex API interactions that define today’s distributed applications.
2. Initial Setup and Core Configuration
Getting started with the latest version of Dev Proxy is a streamlined process, particularly when using the Windows package manager, WinGet. This installation method is highly recommended over the manual option of downloading from GitHub and editing environment variables by hand, as the WinGet install script handles the necessary system configurations automatically. Once the installation is complete via the Windows command line, it is advisable to restart the terminal session to ensure the new environment variables are loaded without needing a full system reboot. The first time Dev Proxy is executed, it requires a couple of one-time security configurations. Users will be prompted to trust and install its security certificate, which is essential for the proxy to intercept and inspect HTTPS traffic. Following this, a prompt from the Windows firewall will require permission for the tool to communicate over the network. These steps are crucial for establishing the proxy as a trusted man-in-the-middle for local development traffic, enabling it to function correctly and securely within the developer’s environment. Once set up, the tool is ready for its initial test run.
The default configuration of Dev Proxy is designed to work out of the box with JSONPlaceholder, a popular and free online REST API for testing and prototyping. This preset configuration immediately demonstrates the proxy’s core capabilities by trapping requests sent to the service and applying a simulated throttling policy combined with a 50% error rate. To see this in action, a developer can send a simple GET request to the JSONPlaceholder API using a command-line tool like PowerShell or curl, or through a dedicated API client such as Postman. The Dev Proxy command-line interface will display real-time feedback, indicating whether the request was passed through to the live service or intercepted to return a simulated error. This initial experience highlights the power that lies within the tool’s configuration files. These files are the key to unlocking its full potential, allowing for the creation of multiple testing scenarios that can be loaded at startup. Developers can build a comprehensive library of configurations to run different tests against a single service or to simulate various services across a project, fostering a collaborative environment where test setups can be shared among team members to accelerate development and ensure consistency.
3. Advanced Mocking and Functional Extension
The configuration file is the heart of Dev Proxy, governing every aspect of its behavior and organized into three primary sections. The first section is a schema declaration, which is common to all configurations and points to the specific version of the configuration schema on GitHub corresponding to the installed Dev Proxy release. This ensures compatibility and provides validation for the file’s structure. The second section contains a list of the plug-ins that will be loaded and activated for the session. These plug-ins are what extend the proxy’s core functionality. The final and most extensive section is the application configuration data, which details the specific behaviors to be applied. This includes defining the URLs of the APIs to be watched, specifying the types of errors to be injected into responses, and setting the rate limits for API calls. Some plug-ins may also require their own configuration blocks within this section, which are applied when the plug-in is loaded. This modular structure provides immense flexibility, allowing developers to be highly selective about how the proxy interacts with network traffic. Some API calls can be allowed to pass through untouched, while others are subjected to error injection and rate limiting, and still others are intercepted entirely and redirected to mock responses hosted by Dev Proxy itself.
To effectively use Dev Proxy for mocking, the first step is to identify the specific API endpoints that need to be intercepted. This is accomplished by running the proxy in a transparent mode, where it discovers and records all network requests originating from a specified application process. It is crucial to specify the process to monitor; otherwise, the proxy will capture every network request from all applications running on the machine, creating an overwhelming amount of noise. Once a list of relevant URLs is captured, developers can begin building out the mock responses. This involves loading the MockResponsePlugin in the configuration file and providing it with a list of API calls to intercept along with their corresponding mock responses. These responses can be simple static JSON files or more complex, dynamic replies. This capability allows developers to simulate the exact data structures and behaviors of a back-end service, enabling comprehensive front-end testing without any dependency on the actual service’s availability or state. By carefully crafting these mock responses, teams can test edge cases, error handling, and UI states that would be difficult to reproduce with a live API.
4. Expanding Capabilities Through Plug-ins
The true power of Dev Proxy lies in its extensible plug-in architecture, which enables developers to move beyond simple mock responses and simulate highly complex API interactions. This system allows for the implementation of sophisticated mocks, such as a basic API that simulates reading from and writing to a database or even one that interacts with an AI service. Plug-ins can also be used to simulate critical production behaviors like authentication flows or to enforce security best practices during development, such as ensuring an application uses the minimum required permissions to access sensitive or personally identifiable information. This makes the proxy not just a tool for mocking data, but a comprehensive platform for testing an application’s security, resilience, and compliance. The ability to create these advanced simulations directly within the development workflow provides invaluable insights long before an application reaches a production environment, helping teams identify and resolve potential issues early in the life cycle.
Moreover, plug-ins are not limited to implementing mock behaviors; they can also be used to introduce temporary telemetry and observability into an application’s API interactions. For example, when working with services like Azure OpenAI, which can be expensive to use during development, a specialized plug-in can be installed to record all interactions. This plug-in can capture detailed telemetry and log API usage to CSV files for later analysis, providing a clear picture of how the application consumes the service. The latest version of the OpenAI telemetry plug-in even tracks cached tokens, offering a precise way to monitor API usage and accurately predict how much token consumption will cost in a production environment. This capability is invaluable for budget planning and performance optimization. Recognizing that the built-in plug-ins may not cover every unique use case, Microsoft also publishes detailed instructions for building custom plug-ins. This empowers development teams to create their own tailored solutions, further extending the proxy’s functionality to meet the specific needs of their projects.
5. Seamless Integration into the Development Ecosystem
To maximize productivity and streamline the use of Dev Proxy, developers using Visual Studio Code can install the Dev Proxy Toolkit extension. This powerful add-on deeply integrates the proxy’s functionality directly into the familiar editor environment, serving as a comprehensive control center for configuring and managing the tool. If Dev Proxy is not already present on the development machine, the toolkit can handle its installation automatically. Once installed, developers can use the toolkit to create and edit configuration files with the help of intelligent autocompletion and validation, significantly reducing the chance of errors. The Visual Studio Code command palette becomes a central hub for controlling the proxy, allowing users to start, stop, and configure it with simple commands. The toolkit also includes a feature for watching and capturing URLs from the application, making it easier to identify endpoints that need to be proxied or mocked. To further accelerate the configuration process, the extension provides a library of JSON snippets that can be used to quickly add specific functions, such as error injection or mock responses, to a configuration file.
For teams leveraging the latest advancements in AI-assisted development, Dev Proxy offers integration with the GitHub Copilot Agent through a Model Context Protocol (MCP) server that can be installed alongside the toolkit. This integration transforms the task of creating complex proxy configurations by enabling developers to generate them from natural language prompts. Instead of manually writing JSON, a developer can simply describe the desired behavior—for example, “create a mock for the user profile API that returns a 404 error 20% of the time”—and the MCP server will generate the corresponding configuration. This feature dramatically lowers the barrier to entry for creating sophisticated test scenarios and allows teams to iterate on their API testing strategies more rapidly. The combination of a rich plug-in ecosystem, deep integration with popular development tools like Visual Studio Code, and cutting-edge AI assistance solidifies Dev Proxy’s position as an indispensable component of the modern development toolchain. Its versatility ensured that it could be adapted to fit different stages of the software development life cycle, evolving alongside an application as its components moved from testing to production.