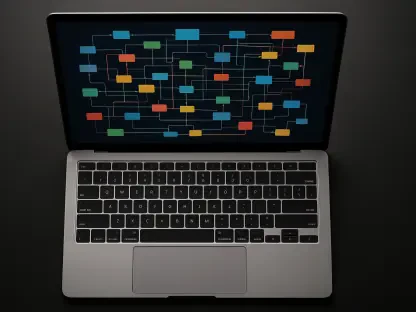

Modern digital environments have reached a level of intricate dependency where a single millisecond of latency in a peripheral microservice can trigger a cascading failure across an entire global infrastructure. In this current landscape, the traditional model of monitoring—which largely focused on predefined metrics and static alerts—has become fundamentally insufficient for the demands of 2026. This inadequacy gave rise to Observability 2.0, a paradigm shift that replaces the simplistic inquiry of whether a system is functional with a much deeper, more investigative approach to system behavior. By moving toward a model of intelligent understanding, organizations can finally peer into the complex web of interactions that define modern performance, ensuring that digital services remain resilient under the weight of unprecedented scale.
The shift toward this new standard is not merely a technical upgrade but a necessary evolution in how the industry manages complexity. While monitoring provides a top-down view of system health, observability offers an inside-out perspective that allows engineers to understand internal states based on external outputs. This transition is essential for navigating the non-deterministic nature of modern software, where failure modes are often unique and impossible to predict. By adopting an Observability 2.0 framework, teams gain the ability to explore their systems in real-time, moving beyond the limitation of pre-configured dashboards and entering a state of continuous, data-driven discovery.
The Evolution of System Visibility: From Static Monitoring to Intelligent Understanding
Traditional monitoring served its purpose when applications were monolithic and predictable, yet the migration toward cloud-native architectures and serverless functions has rendered those methods largely obsolete. In the past, an operations team might set a threshold for CPU usage and wait for a notification; today, that approach fails to account for the ephemeral nature of containers and the volatility of microservices. The shift toward modern observability is driven by the need for a granular, high-fidelity view of every request as it passes through various layers of the stack. This is no longer just about keeping the lights on; it is about providing Site Reliability Engineers and DevOps teams with the forensic tools necessary to untangle the knotted threads of a distributed environment.
The importance of this transition lies in the ability to ask questions of a system that were not anticipated at the time the code was written. While legacy monitoring required developers to know exactly what they wanted to track in advance, Observability 2.0 treats system data as a continuous stream of exploratory potential. This capability is vital for organizations operating at scale, where the failure of a single component might not bring the system down but could significantly degrade the user experience in ways that traditional alerts would never catch. By prioritizing the search for root causes over the mere observation of symptoms, teams are moving toward a state of constant readiness rather than constant reaction.
Furthermore, the role of the platform provider has shifted from offering simple visualization tools to providing comprehensive analysis engines. These engines must handle the massive influx of data generated by modern architectures without sacrificing the speed of retrieval. As distributed systems become the standard, the ability to correlate data across different services has become the primary differentiator for successful DevOps teams. The move toward intelligent understanding ensures that when a failure occurs, the focus is immediately directed toward the specific interaction that caused the anomaly, dramatically reducing the time wasted on manual troubleshooting and guesswork.
Market Dynamics and the Rise of Telemetry Standardization
Emerging Trends in Distributed System Analysis
The industry is currently moving away from the isolated “Three Pillars” of observability—logs, metrics, and traces—and toward a unified, correlated telemetry model. For a long time, these three data types lived in separate silos, forcing engineers to manually piece together information during an incident. The emergence of OpenTelemetry as a global, vendor-neutral standard has changed this dynamic by providing a common language for data collection. This standardization allows for seamless integration across different platforms, ensuring that telemetry data remains consistent and portable regardless of the specific vendor or tool used for analysis.
Moreover, the “Shift Left” movement is embedding observability directly into the earlier stages of the development cycle. Rather than waiting for a production incident to understand how a system behaves, developers are now integrating telemetry into their continuous integration and delivery pipelines. This proactive approach ensures that potential bottlenecks and architectural flaws are identified before they ever reach the end user. Additionally, as organizations increasingly deploy large language models and automated agents, a new niche of AI-specific observability has emerged. These tools focus on monitoring the non-deterministic outputs of AI, ensuring that hallucinations or latency in model calls are caught before they impact the broader application ecosystem.
Growth Projections and the Future of the Observability Market
Economic forecasts for the period from 2026 to 2028 indicate a robust expansion of the observability market as enterprises abandon legacy frameworks in favor of intelligent, automated solutions. The growth is fueled by the realization that manual troubleshooting is no longer financially viable in a world of a thousand microservices. As organizations scale their digital footprints, the demand for tools that offer automated root-cause analysis is expected to skyrocket. This trend suggests that the market will increasingly reward providers who can distill massive amounts of data into actionable insights rather than just providing another dashboard.
Performance indicators like Mean Time to Understanding (MTTU) and Mean Time to Recovery (MTTR) have become the primary benchmarks for success in this new market. Companies are no longer satisfied with simply knowing an issue exists; they require the context necessary to fix it instantly. Data-driven forecasts show that the adoption of high-cardinality data processing will be a key differentiator for industry leaders. By focusing on these metrics, organizations can justify the investment in advanced observability platforms as a means of protecting revenue and ensuring customer satisfaction in an increasingly competitive digital marketplace.
Navigating the Challenges of High-Cardinality Data and Cost
One of the most pressing hurdles in the current technological climate is the “Data Deluge,” where the sheer volume of telemetry data threatens to overwhelm both budgets and infrastructure. High-cardinality data, which includes unique identifiers like user IDs or session tokens, provides incredible depth but comes at a high financial cost for storage and processing. Organizations are finding that blindly collecting every piece of information is a recipe for fiscal disaster. Consequently, a more disciplined approach to telemetry management has become essential, focusing on the value of the data rather than its volume.
To combat this, sophisticated strategies such as intelligent sampling and value-based data retention are being widely adopted. Instead of storing every single successful trace, systems are being programmed to keep a representative sample of healthy requests while capturing 100% of error-prone or slow ones. This reduction in noise helps alleviate alert fatigue, a common condition where DevOps teams become desensitized to notifications due to a constant stream of low-priority warnings. By focusing on contextual correlation, modern platforms can suppress redundant alerts and highlight only the specific signals that indicate a genuine threat to system stability.
Achieving full-stack visibility across hybrid and multi-cloud environments remains a significant technical challenge. Data often becomes trapped in provider-specific silos, making it difficult to get a unified view of an entire estate. Solutions for telemetry discipline involve creating a centralized control plane that can ingest data from various sources while applying consistent policies for filtering and analysis. This approach allows organizations to maintain high levels of visibility without the prohibitive costs associated with raw data ingestion, ensuring that observability remains a sustainable practice even as systems continue to grow.
The Regulatory Landscape and Data Privacy Standards
As telemetry data becomes more detailed, the intersection of observability and data privacy has become a critical focal point for legal and compliance teams. Regulations such as GDPR and HIPAA impose strict requirements on how personal information is handled, even when that information is buried deep within a system log or a distributed trace. Organizations must now navigate the delicate balance between maintaining full system transparency and ensuring that sensitive metadata is appropriately obfuscated or redacted. This requirement has led to the development of privacy-aware observability tools that can automatically identify and mask sensitive fields in real-time.
The impact of these industry standards is reshaping how organizations store and process metadata. It is no longer enough to have an efficient logging system; that system must also be inherently secure and compliant with global privacy mandates. This has given rise to the concept of “Secure Observability,” where security protocols are baked into the telemetry collection process itself. By standardizing these practices, the industry is moving toward a future where system transparency does not come at the cost of user privacy. This regulatory pressure is also driving innovation in decentralized data processing, allowing for local analysis that minimizes the need to transport sensitive data across borders.
In addition to privacy concerns, the role of security in observability includes the detection of sophisticated cyber threats. By analyzing patterns in telemetry data, organizations can identify anomalous behavior that might indicate a breach or an ongoing attack. However, this requires an even higher level of data integrity and protection, as the observability tools themselves could become targets for attackers. Balancing the need for deep forensic data with the necessity of data obfuscation is one of the most complex tasks facing modern SRE teams, requiring a multi-layered approach to telemetry security.
The Future of Digital Ecosystems: AI-Driven Insights and Automation
The integration of machine learning into the observability stack is transforming the role of the engineer from a manual investigator to a strategic system orchestrator. Predictive anomaly detection now allows systems to identify patterns that precede a failure, enabling teams to intervene before a service disruption occurs. This evolution toward “Observability by Design” means that software is no longer built and then monitored; instead, it is built with the inherent capacity to explain its own internal state. This shift is fundamental to managing the next generation of digital ecosystems, where manual oversight is physically impossible due to the scale and speed of operations.
Looking ahead, the most significant disruptor in this space will be the rise of self-healing infrastructure and automated remediation. In this scenario, the observability platform does more than just notify a human; it triggers a predefined automated response to resolve the issue. Whether it is re-routing traffic away from a failing node or automatically scaling resources to meet a sudden surge in demand, these systems are becoming increasingly autonomous. This change allows engineers to focus on high-level architectural improvements rather than getting bogged down in repetitive troubleshooting.
The changing role of the engineer also necessitates a new set of skills focused on managing these automated systems. As infrastructure becomes more self-sufficient, the focus shifts toward ensuring the quality of the data that drives the automation. Engineers must become experts at defining the service-level objectives and the logic that governs automated responses. The goal is to create a digital environment that is not only observable but also inherently resilient and capable of self-correction, reducing the burden on human teams and increasing the overall reliability of the digital services they provide.
Strategic Summary: Embracing Observability 2.0 for Long-Term Resilience
The transition toward Observability 2.0 demonstrated that raw data was a liability unless it transformed into immediate action. Organizations that successfully navigated this shift realized that deep system understanding was the only viable path to maintaining uptime in an increasingly volatile digital landscape. This era marked a definitive departure from the reactive habits of the past, as teams moved toward a proactive model that prioritized high-fidelity context over simple status checks. The implementation of standardized telemetry frameworks like OpenTelemetry proved to be a pivotal step in democratizing data access across entire departments, breaking down the traditional barriers between developers and operations staff.
Refining the balance between data volume and insight quality became a core strategic priority for technology leaders. The adoption of intelligent sampling and automated root-cause analysis allowed businesses to scale their infrastructure without a linear increase in monitoring costs. This shift empowered engineers to move away from the grueling cycle of manual fire-fighting and toward a more strategic role focused on system orchestration and architectural integrity. It was clearly observed that those who embraced “Observability by Design” were far better equipped to handle the complexities of distributed cloud environments and AI-integrated workloads.
The necessity of maintaining a clear, real-time map of system interactions became the foundation for long-term operational resilience. It was clear that as complexity continued to rise, the ability to observe, analyze, and act with precision remained the most critical asset for any technology-driven enterprise. For those looking to invest further in this space, the emphasis shifted toward the refinement of automated remediation and the continuous integration of machine learning to stay ahead of emerging failure patterns. Ultimately, the maturity of Observability 2.0 provided the structural stability needed for the next wave of digital innovation to thrive in a global economy.